8. Reading simulation results
When a revision's simulations finish, the Simulation results section fills with result cards for the selected revision. This guide covers the voltage and current results. Efficiency maps are covered in guide 9.
Voltage
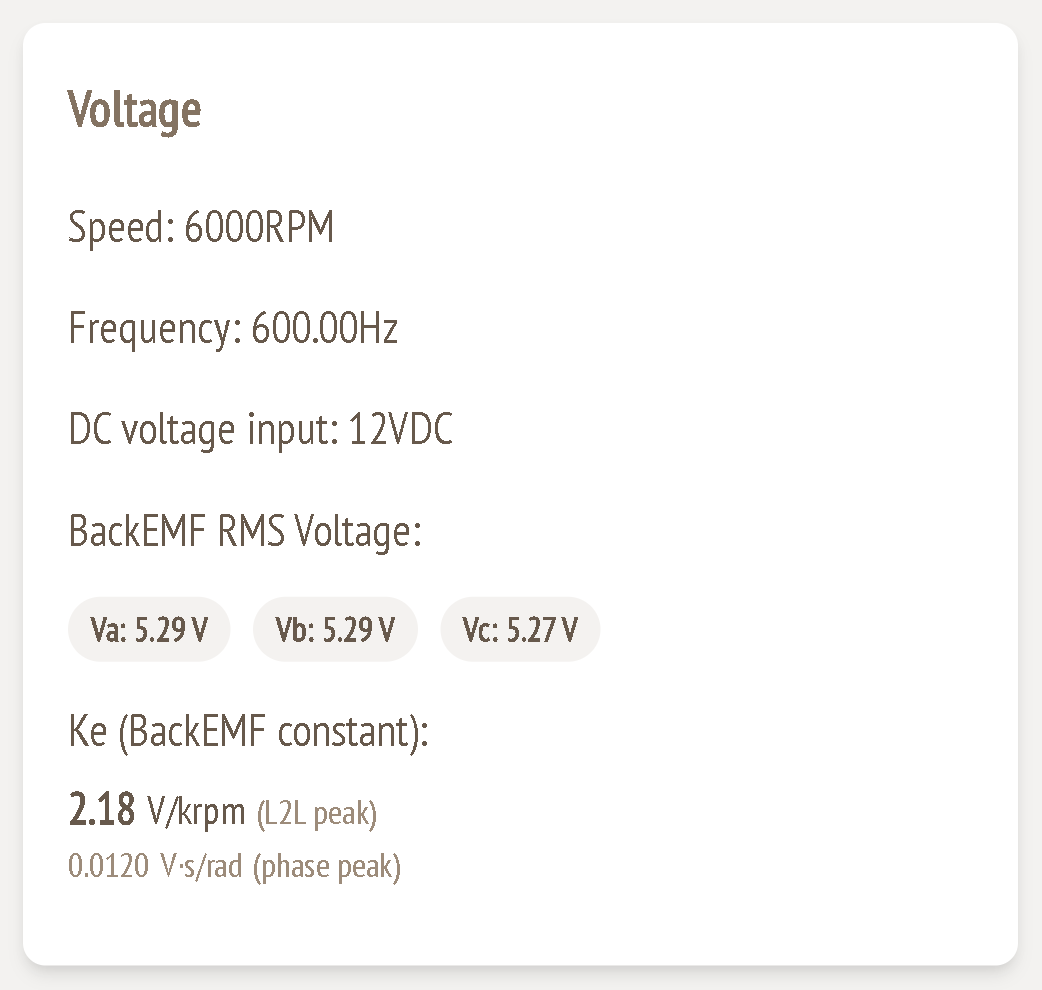
| Field | Meaning |
|---|---|
| Speed | Speed the back-EMF was evaluated at (the nominal speed) |
| Frequency | Electrical frequency: RPM × poles / 120. Example: 6000 × 12 / 120 = 600 Hz. |
| DC voltage input | The supply voltage of this revision |
| BackEMF RMS Voltage Va / Vb / Vc | Simulated open-circuit RMS phase voltage for each phase. The three should be almost equal. A clear imbalance points to a winding or model problem. |
| Ke (BackEMF constant) | Back-EMF per unit speed, in two forms: V/krpm (L2L peak), the line-to-line peak voltage per 1000 RPM, which is the form most drive datasheets use; and V·s/rad (phase peak), the phase peak voltage per rad/s, which is the form motor-control (dq) models and FOC tuning tools usually ask for. |
Checking Ke against the RMS values: 5.29 V RMS × √2 × √3 ≈ 12.96 V line-to-line peak at 6000 RPM, which is 2.16 V/krpm. That matches the reported 2.18 V/krpm (the Ke is averaged over the three phases).
Back-EMF charts
The chart card has four tabs. Click the ⤢ icon to view a chart full screen.
BackEMF Line2Line
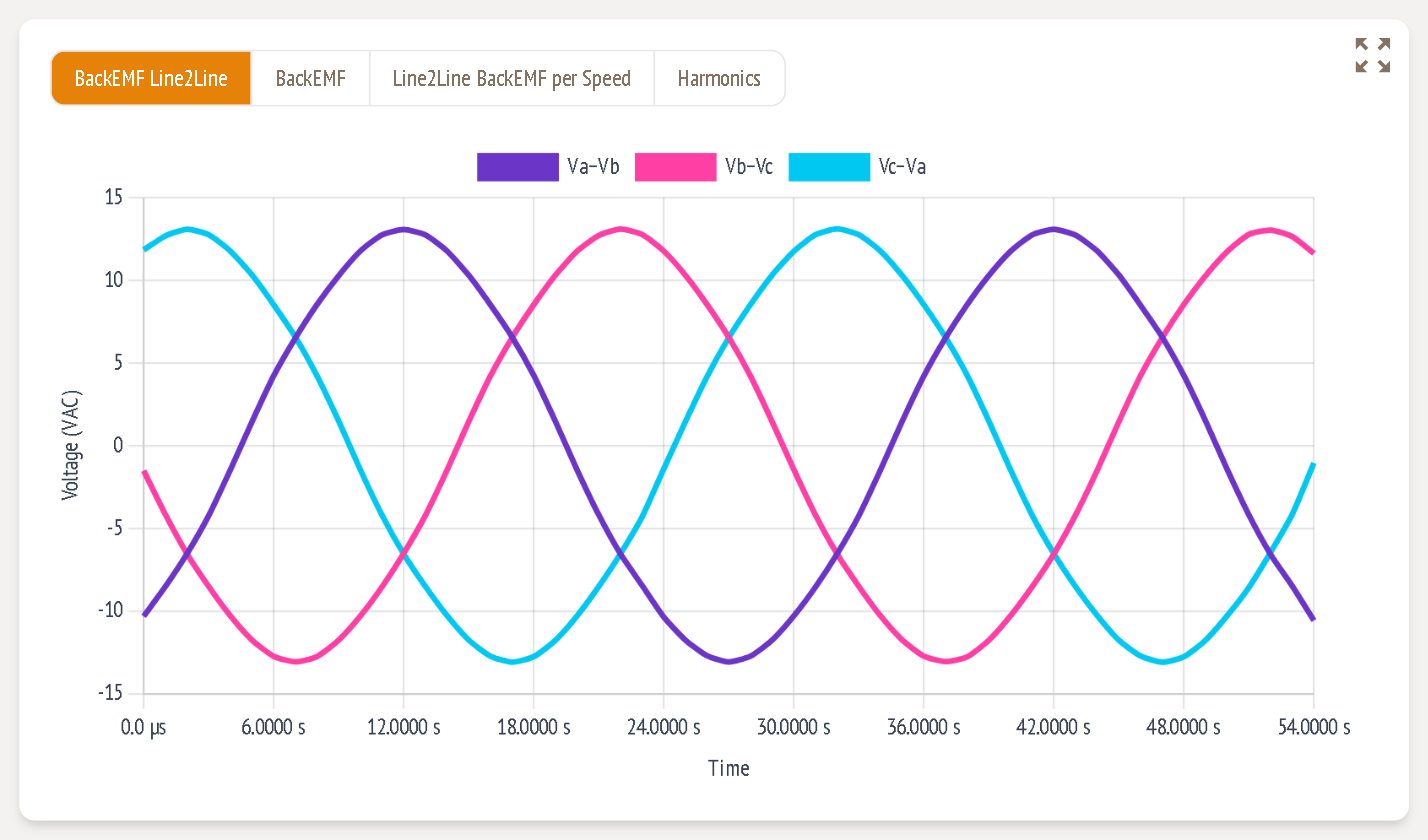
Line-to-line voltages (Va–Vb, Vb–Vc, Vc–Va) over time at nominal speed. This is the waveform your inverter sees, so it should be smooth and close to a sine wave.
BackEMF
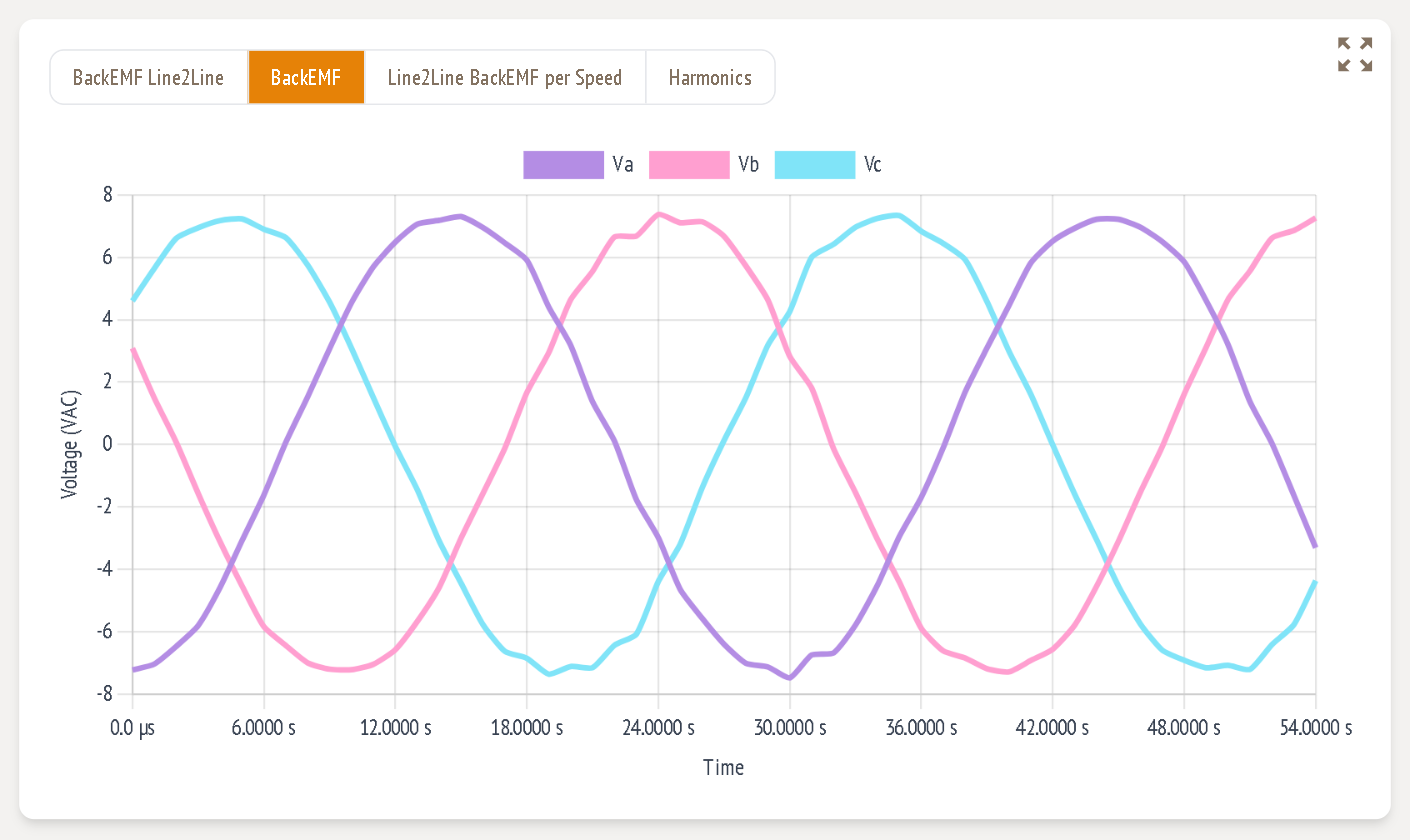
Phase voltages (Va, Vb, Vc). These often look slightly flattened or trapezoidal because of the 3rd harmonic. A 3-wire drive can't see the 3rd harmonic, so don't judge the design by the phase waveform. Use the Harmonics tab instead.
Line2Line BackEMF per Speed
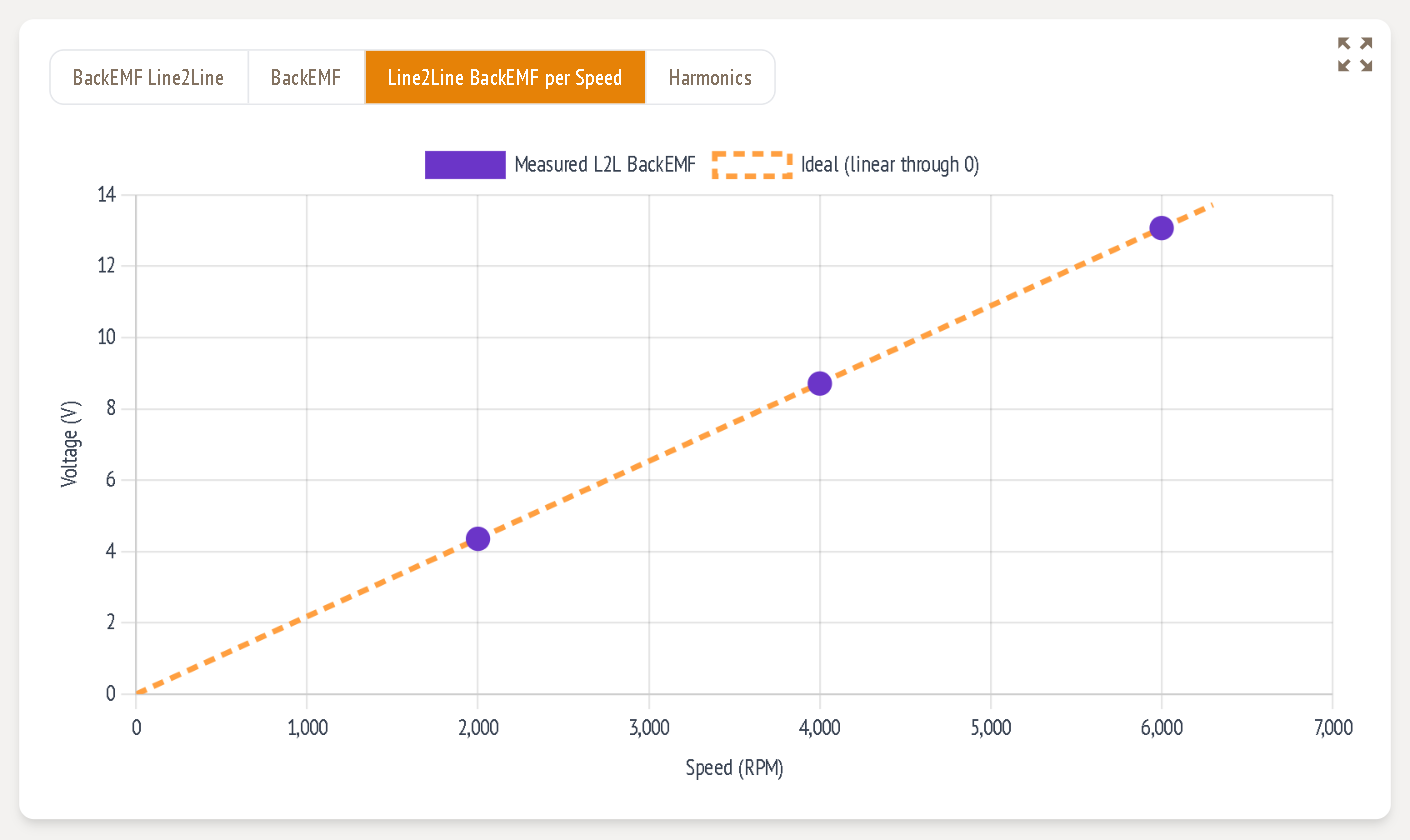
Simulated line-to-line back-EMF at several speeds (dots), against an ideal straight line through zero (dashed). A coreless motor has no iron to saturate, so the points should sit on the line. The slope of the line is the Ke.
Harmonics
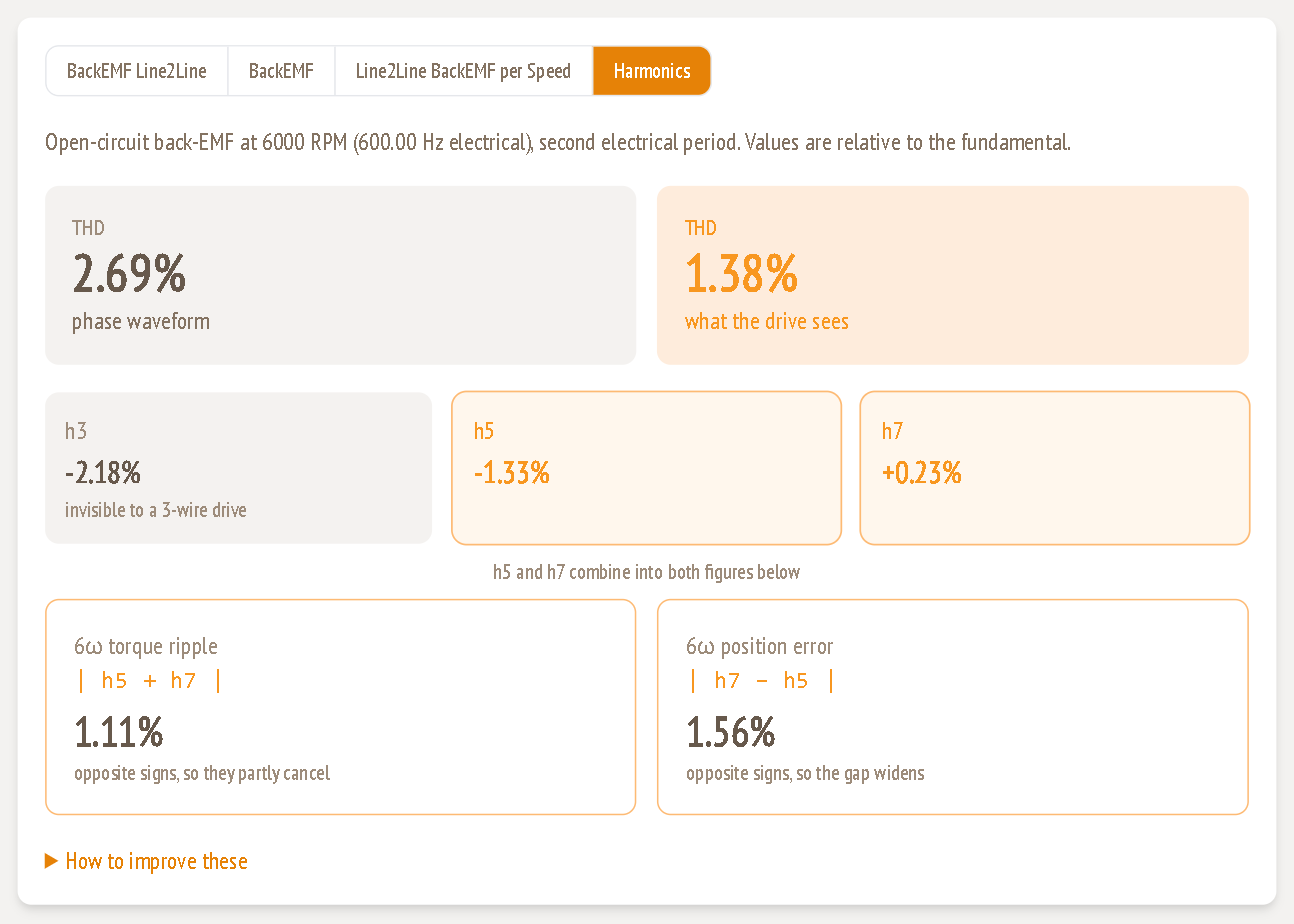
This tab analyses the open-circuit back-EMF at nominal speed. Harmonics are shown relative to the fundamental.
| Field | Meaning |
|---|---|
| THD, phase waveform | Total harmonic distortion of the phase voltage, including the 3rd harmonic |
| THD, what the drive sees | THD of the line-to-line voltage. The 3rd harmonic cancels here, so this is the figure that matters. |
| h3 | 3rd harmonic. It can't be seen by a 3-wire drive, so ignore it. |
| h5, h7 | 5th and 7th harmonics. Together they cause torque ripple and sensorless position error at 6× the electrical frequency. |
| 6ω torque ripple = |h5 + h7| | Lower means smoother torque. When h5 and h7 have opposite signs they partly cancel. |
| 6ω position error = |h7 − h5| | Lower means more accurate sensorless (observer) control. |
Expand How to improve these for tuning advice. In short:
- The magnet span angle steers h5, while h7 hardly moves.
- If h5 is negative, widen the span.
- If h5 is positive, narrow it.
- For the lowest torque ripple, aim for h5 ≈ −h7.
- For the lowest position error, aim for h5 ≈ h7.
- Both are low only when h5 and h7 are both near zero. Otherwise choose ripple (smooth torque) or position error (sensorless accuracy).
- Change the span in steps of 0.02, re-run the back-EMF simulation, and read h5 again.
- A wider air gap also lowers h5 and ripple, at the cost of torque.
Current
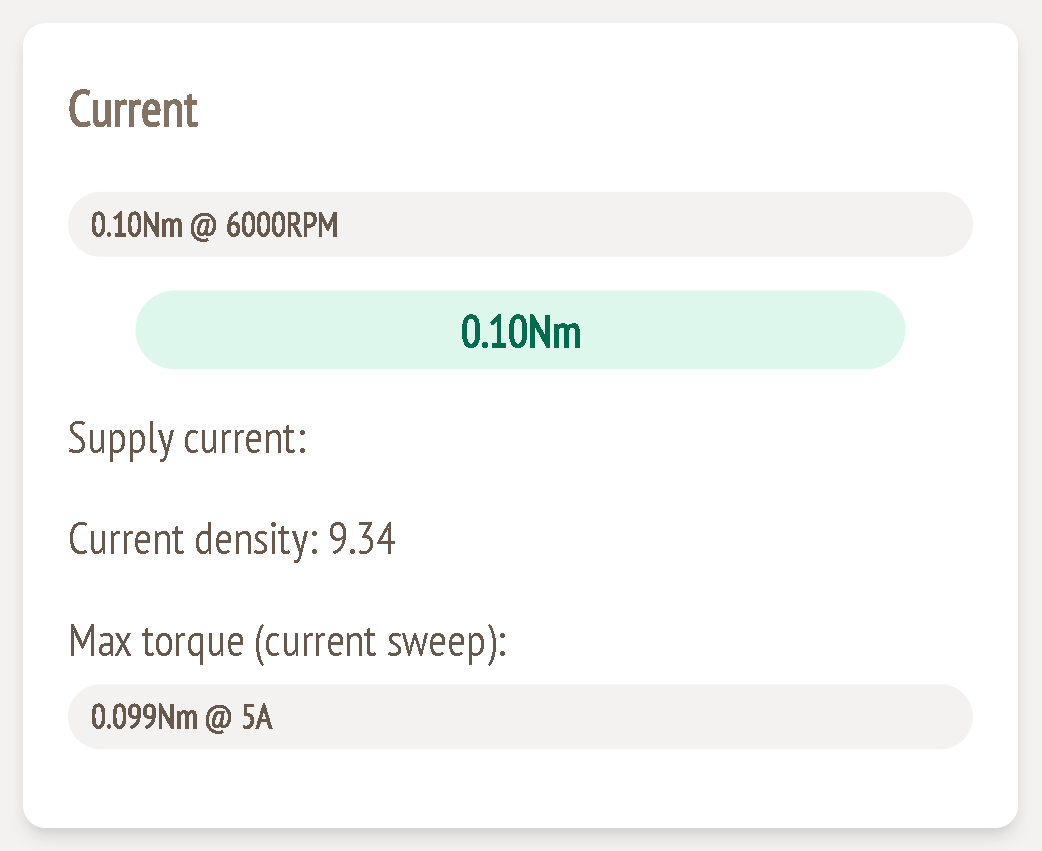
| Field | Meaning |
|---|---|
| 0.10Nm @ 6000RPM | The operating point this revision was designed for (nominal torque and speed) |
| Torque pill | The required nominal torque |
| Current density | Winding current density at the phase current, in A/mm² (guide 3) |
| Max torque (current sweep) | Simulated torque at the design's phase current, taken from the current sweep. Compare it with the required torque: if it's lower, the motor needs more current than planned to reach nominal torque. |
Max Current
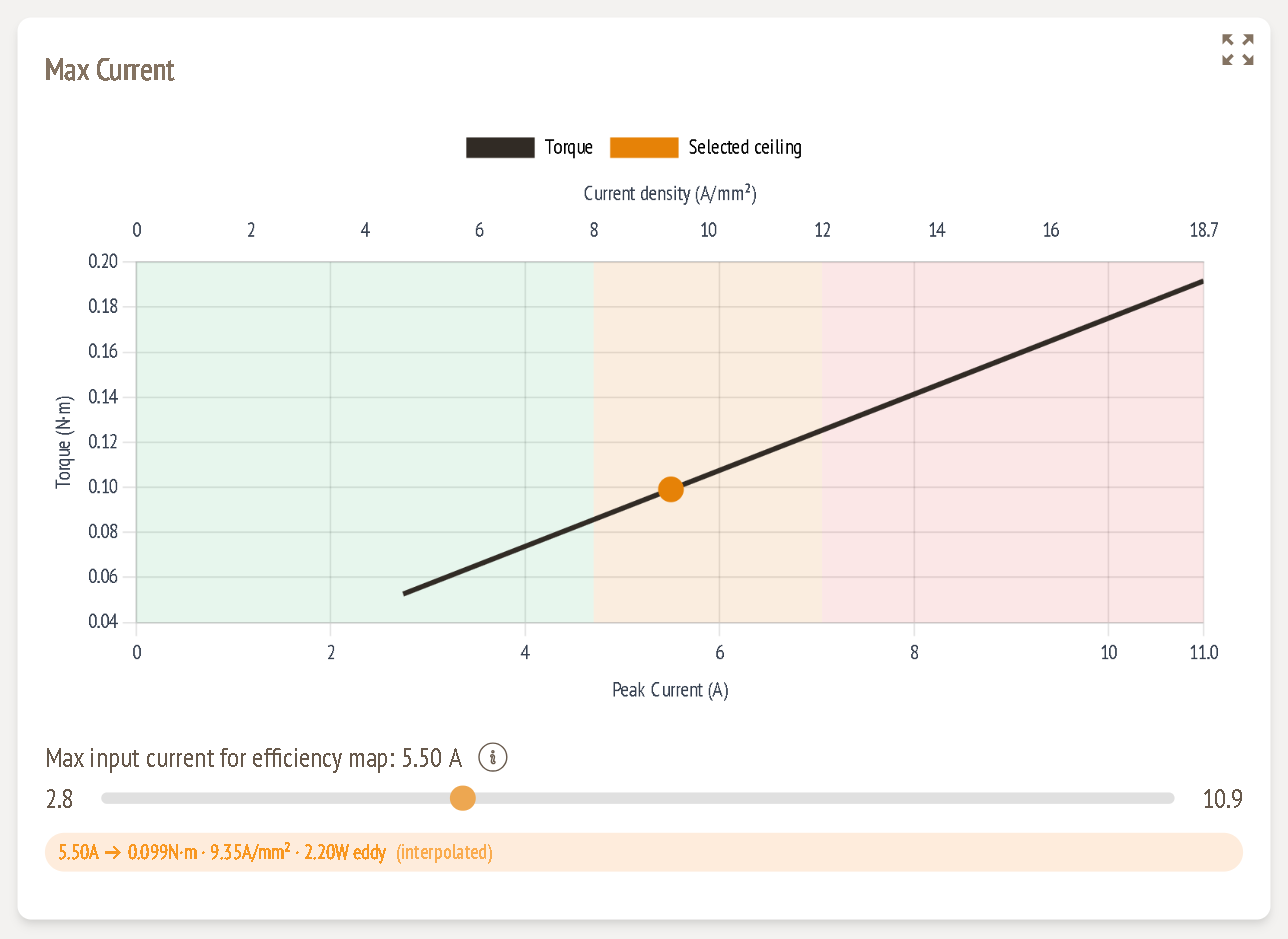
The simulation sweeps the phase current and records the torque. The chart shows:
- Torque vs. peak current (black line, bottom axis) and the matching current density (top axis)
- Background bands: green up to 8 A/mm², amber 8–12 A/mm², red above 12 A/mm²
- Selected ceiling (orange dot): the current chosen with the slider below
In a coreless motor the torque rises almost linearly with current, because there's no iron to saturate. Current is limited by heating, not by saturation, which is why the chart is banded by current density.
Max input current for efficiency map
Range: the currents the solver computed for this design (example: 2.8 – 10.9 A)
This sets the top of the current axis for the next efficiency map you generate. The top grid point lands exactly on this value, and no point goes above it. The readout underneath shows what that current means:
5.50 A → 0.099 N·m · 9.35 A/mm² · 2.20 W eddy (interpolated)
That is: torque, current density and eddy-current loss at the selected current, interpolated from the sweep.
How to choose it:
- Set it to the highest current you'll really use, such as your controller's current limit or your short-term overload.
- Staying in the green or amber band gives a map of realistic continuous and short-term operation.
- Going into the red band shows peak capability, but those points aren't thermally sustainable.